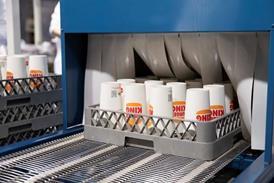
Reusable packaging has a huge problem. Consumers express enthusiasm for refillable concepts, but demonstrate dramatically lower willingness to actually seek out refill stations. How can this problem be solved? In this article, Calvin Lakhan, Director of Circular Innovation Hub at York University’s Faculty of Environment and Urban Change, breaks down the findings of a fascinating new study on this issue.
The sustainability promise vs consumer reality
The “value-action gap” represents a critical barrier to sustainability efforts that many businesses fail to address – simply designing refillable options isn’t enough when 58% of expressed consumer interest fails to translate into action.
Not all products are created equal: The four distinct opportunity segments
Cluster analysis identified four distinct product groupings that require fundamentally different strategies:
- High Potential Products (Garden products, rice/grains, nuts, coffee, flour) – These categories demonstrate the smallest value-action gaps (1.21 average) and highest engagement scores (2.34/5.0). These shelf-stable staples with routine purchasing patterns represent the most promising immediate opportunities.
- Moderate Potential with Barriers (Pet supplies, ink products, laundry products, spices) – These categories show strong willingness (3.48/5.0) but encounter significant barriers at the action stage, creating a moderate gap (1.58 average). They require targeted barrier removal.
- Limited Appeal Products (Body products, makeup, face care, shampoo, surface cleaners) – Despite moderate willingness (3.04/5.0), these categories face severe barriers, particularly hygiene concerns, resulting in very low engagement (1.32/5.0) and large gaps (1.72 average).
- Low Potential Products (Writing tools, wine/spirits, condiments, cooking oils, adhesives) – These infrequently purchased specialty items face fundamental packaging barriers, showing both low willingness (2.33/5.0) and engagement (1.09/5.0).
The barrier hierarchy: What actually prevents adoption?
Regression analysis explains 53.2% of the adoption gap variance, revealing the true hierarchy of barriers:
- Convenience Barriers (β=0.38) – The inconvenience of carrying containers, forgetting containers, and time required for refilling represent the primary obstacles.
- Convenience Orientation (β=0.38) – Consumers who prioritize convenience in their shopping habits demonstrate significantly wider gaps between intention and action.
- Hygiene/Safety Concerns (β=0.32) – Worries about product contamination and cleanliness create substantial resistance, particularly for personal care products (correlation r=0.58-0.63).
- System Limitations (β=0.27) – Limited availability of refill stations and insufficient information about options create significant structural barriers.
- Economic Considerations (β=0.14) – Surprisingly, price sensitivity plays a much smaller role than commonly assumed.
The consumer segmentation opportunity
Analysis revealed three distinct consumer segments with dramatically different adoption patterns:
- “Deliberate Planners” (33.3% of consumers) – These organized shoppers with high planning tendencies demonstrated significantly higher engagement scores (2.09/5.0) and smaller value-action gaps (1.12 average). They represent the early adoption audience.
- “Convenience Shoppers” (39.9%) – These consumers prioritize efficiency and demonstrate the largest value-action gaps (1.67 average) with very low engagement scores (1.31/5.0). They require frictionless solutions.
- “Price-Focused Shoppers” (26.8%) – These price-sensitive consumers show moderate gaps (1.42 average) but are highly motivated by economic incentives.
Geographic insights: The Canadian advantage
A striking finding emerged in the cross-country comparison: While willingness scores were comparable between countries, Canadian consumers demonstrated progressively higher scores for likelihood (β=0.15) and active engagement (β=0.24), resulting in significantly smaller value-action gaps (1.29 vs. 1.66). This suggests that cultural factors and infrastructure availability play critical roles in sustainable behaviour adoption.
Strategic implementation recommendations
- Staged Category Introduction – Begin with food staples where acceptance is highest, then expand to moderate-potential categories only after addressing their specific barriers.
- Convenience Engineering – Design systems that integrate seamlessly with existing shopping routines, minimize container transport challenges, and reduce cognitive load.
- Segment-Specific Messaging – Develop targeted communications for each consumer segment: For Deliberate Planners: Highlight planning benefits and environmental impact For Convenience Shoppers: Emphasize ease-of-use and time savings For Price-Focused Shoppers: Quantify economic incentives clearly
- Barrier-Specific Mitigation – Address each key barrier with strategic interventions: For hygiene concerns: Transparent sanitation protocols and system design For convenience barriers: Container drop-off/pickup services and simplified processes For system limitations: Infrastructure expansion and improved visibility
- Regional Adaptation – Recognize that implementation strategies may need adjustment based on geographic differences in consumer behavior and infrastructure.
This research provides substantial insight into the psychological and practical factors influencing refillable packaging adoption.
By understanding and addressing category-specific barriers and consumer segments strategically, businesses can transform sustainability initiatives from concepts consumers merely approve of into services they actively seek out.
If you liked this story, you might also enjoy:
The ultimate guide to the Packaging and Packaging Waste Regulation in 2025
How are the top brands progressing on packaging sustainability?
Everything you need to know about global packaging sustainability regulation in 2025
The key to increasing the use of reusable packaging in supermarkets


No comments yet